> ## Documentation Index
> Fetch the complete documentation index at: https://docs.pelanor.io/llms.txt
> Use this file to discover all available pages before exploring further.
# Alerts
> How to use the Alerts feed to view, filter and understand alerts within your cloud.
 Pelanor **Alerts** help FinOps and DevOps teams stay on top of important cost-related events in the cloud infrastructure. They combine built-in and customizable alerts that you can adapt to your organization’s processes and priorities.
## Alert Types
* **Anomaly Alert** – triggered when a custom Anomaly Monitor crosses its notification threshold
* **Budget Alert** – triggered when spend exceeds the configured budget threshold
* **Real-Time Metrics Alert (Beta)** – raised when the platform detects a spike in real-time metrics that could lead to a future cost spike
## Alert Statuses
* **Active Alert** – the alert is open and currently relevant
* **Dismissed** – the alert was manually closed via the **Status** dropdown
* **Timed Out** – the alert was automatically closed after exceeding the **Timeout Duration** set in the Anomaly Monitor (Anomaly alerts only)
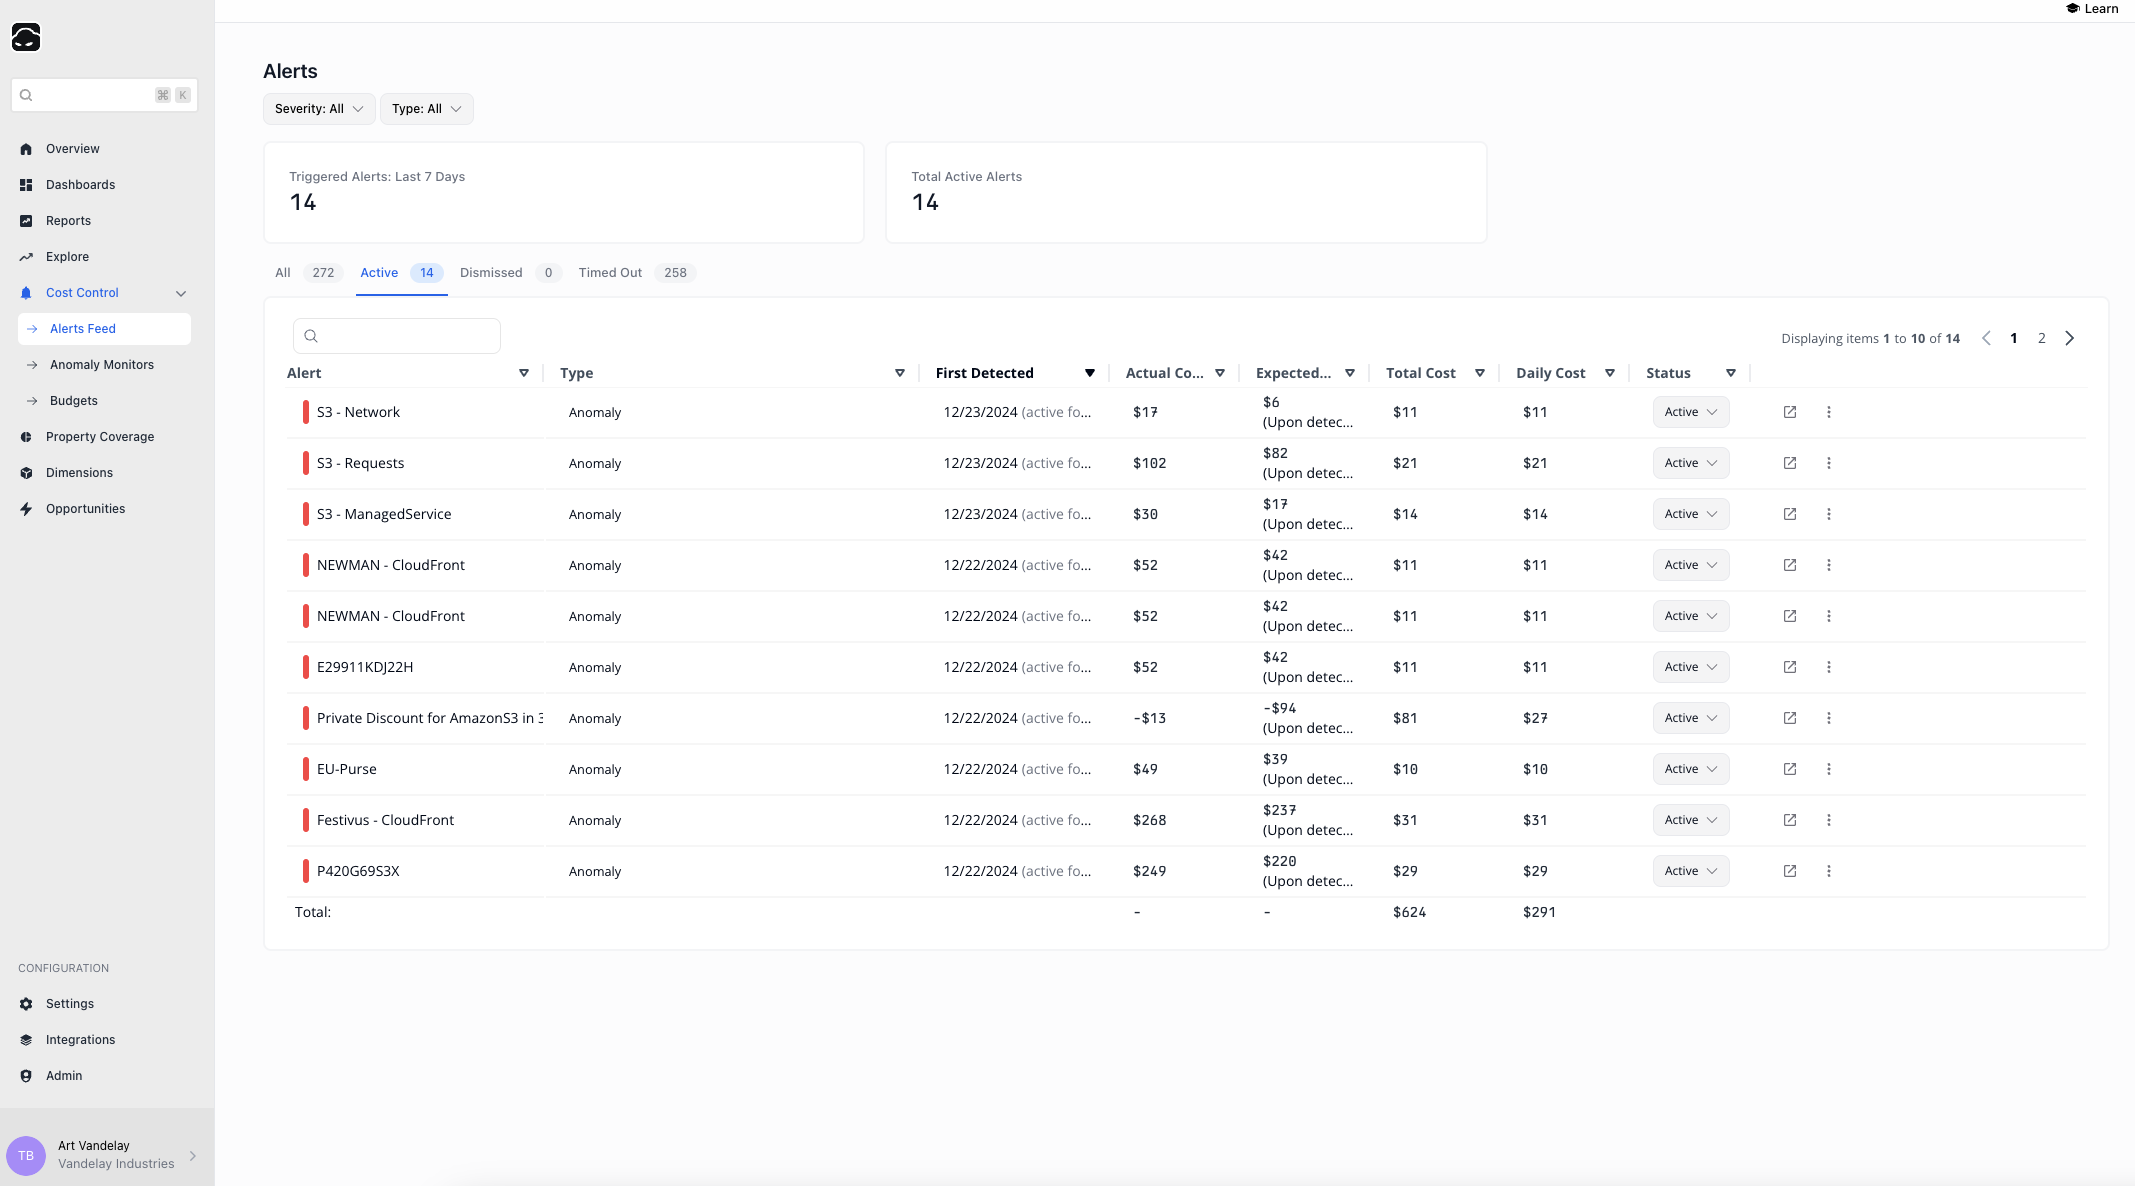
## Alerts List
The **Alerts List** screen shows all alerts in the active Workspace. By default, only **Active** alerts are displayed.
| Column Name | Description | Example |
| ----------- | ------------------------------------------------------------------------------- | ----------------------------------------------------------- |
| Alert | The entity to which the alert pertains (a specific resource or a resource set). | `arn:aws:eks:us-east-1:932414050906:cluster/sock-shop-demo` |
| Type | Alert Type: Anomaly Alert, Budget Alert, Real-Time Metrics Alert. | Anomaly Alert |
| Status | Alert Status: Active, Dismissed, Timed Out. | Timed Out |
## Alert Details
Pelanor **Alerts** help FinOps and DevOps teams stay on top of important cost-related events in the cloud infrastructure. They combine built-in and customizable alerts that you can adapt to your organization’s processes and priorities.
## Alert Types
* **Anomaly Alert** – triggered when a custom Anomaly Monitor crosses its notification threshold
* **Budget Alert** – triggered when spend exceeds the configured budget threshold
* **Real-Time Metrics Alert (Beta)** – raised when the platform detects a spike in real-time metrics that could lead to a future cost spike
## Alert Statuses
* **Active Alert** – the alert is open and currently relevant
* **Dismissed** – the alert was manually closed via the **Status** dropdown
* **Timed Out** – the alert was automatically closed after exceeding the **Timeout Duration** set in the Anomaly Monitor (Anomaly alerts only)
## Alerts List
The **Alerts List** screen shows all alerts in the active Workspace. By default, only **Active** alerts are displayed.
| Column Name | Description | Example |
| ----------- | ------------------------------------------------------------------------------- | ----------------------------------------------------------- |
| Alert | The entity to which the alert pertains (a specific resource or a resource set). | `arn:aws:eks:us-east-1:932414050906:cluster/sock-shop-demo` |
| Type | Alert Type: Anomaly Alert, Budget Alert, Real-Time Metrics Alert. | Anomaly Alert |
| Status | Alert Status: Active, Dismissed, Timed Out. | Timed Out |
## Alert Details
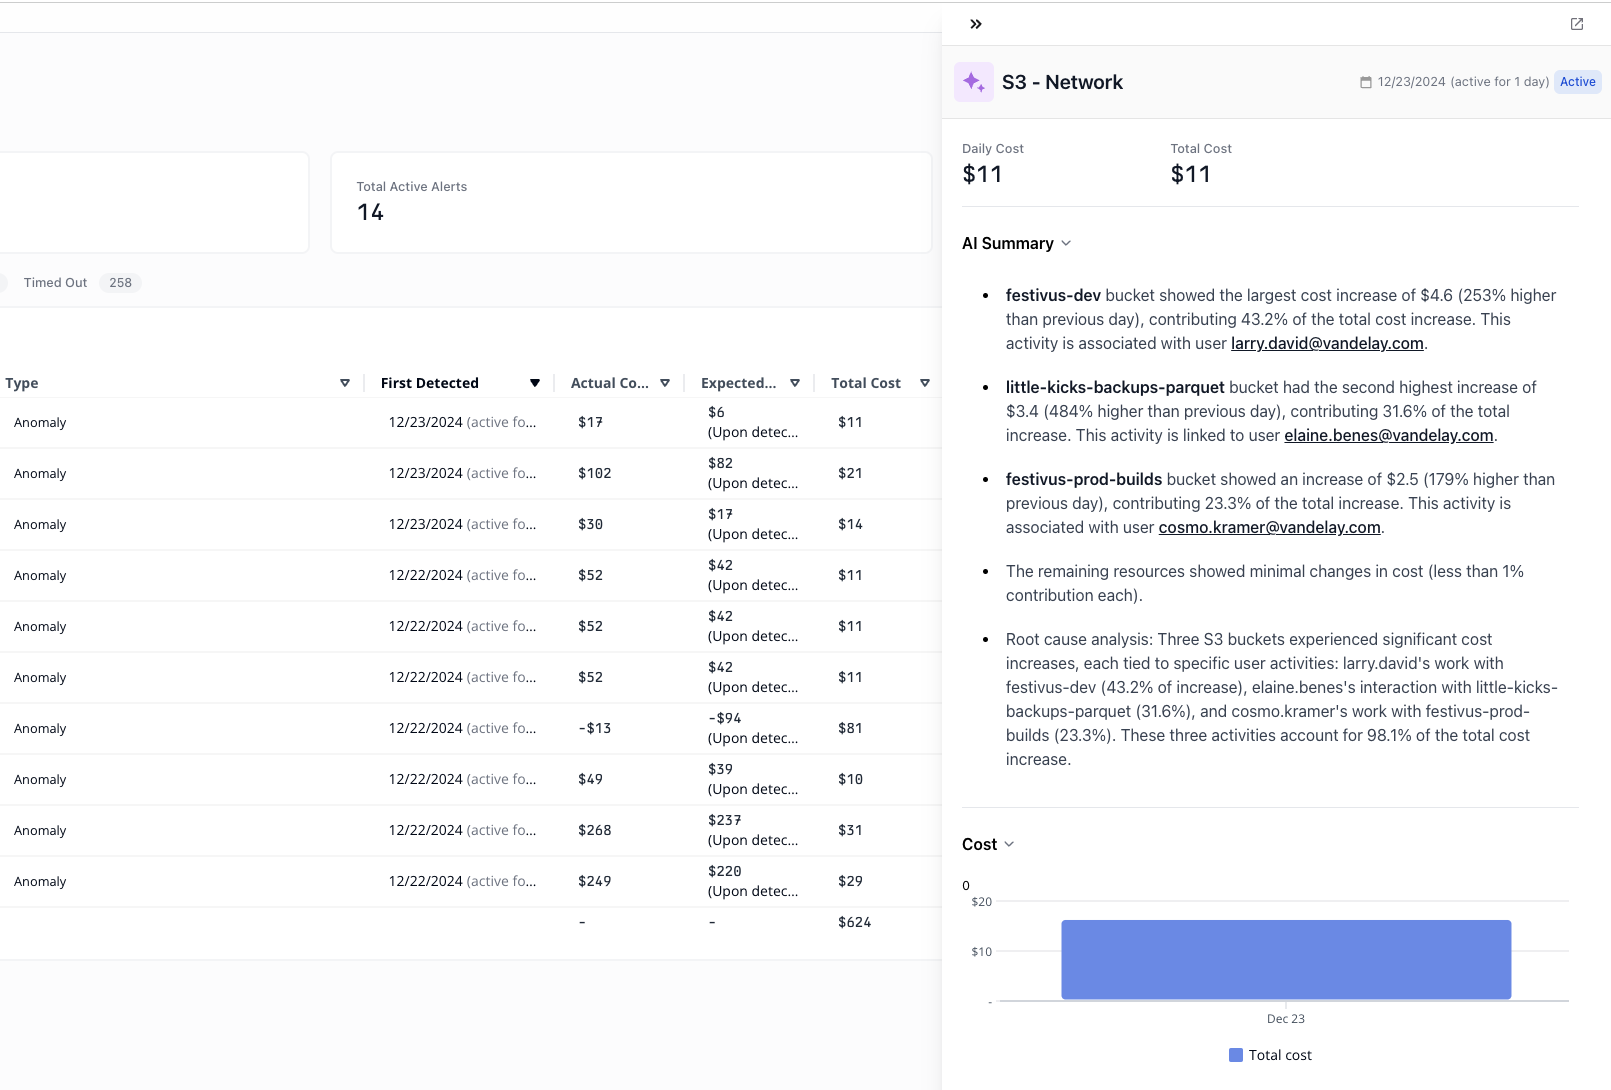 Click an alert to view its detail panel:
* **AI Summary** – an AI-generated summary describing the cost trend, environment, and impact
* **Alert Type** – Anomaly, Budget, or Real-Time Metrics
* **Cost Chart Preview** – recent daily cost analytics for the entity (open **Detailed Alert Analysis** for full charts)
## Quick Actions
From the **Alerts List** you can:
* **Detailed Alert Analysis** – open an editable report plus the full AI Summary for root-cause analysis
* **View Monitor / Budget** – jump to the corresponding Anomaly Monitor or Budget configuration
* **Change Alert Status** – set the status directly in the table
## Best Practices
1. Review the Alerts Feed regularly to spot anomalies and budget overruns.
2. Use severity filters to focus on high-impact alerts.
Click an alert to view its detail panel:
* **AI Summary** – an AI-generated summary describing the cost trend, environment, and impact
* **Alert Type** – Anomaly, Budget, or Real-Time Metrics
* **Cost Chart Preview** – recent daily cost analytics for the entity (open **Detailed Alert Analysis** for full charts)
## Quick Actions
From the **Alerts List** you can:
* **Detailed Alert Analysis** – open an editable report plus the full AI Summary for root-cause analysis
* **View Monitor / Budget** – jump to the corresponding Anomaly Monitor or Budget configuration
* **Change Alert Status** – set the status directly in the table
## Best Practices
1. Review the Alerts Feed regularly to spot anomalies and budget overruns.
2. Use severity filters to focus on high-impact alerts.