> ## Documentation Index
> Fetch the complete documentation index at: https://docs.pelanor.io/llms.txt
> Use this file to discover all available pages before exploring further.
# Dashboards
> Learn how to build detailed dashboards using your saved reports, and how to customize their presentation and scheduled delivery to stakeholders.
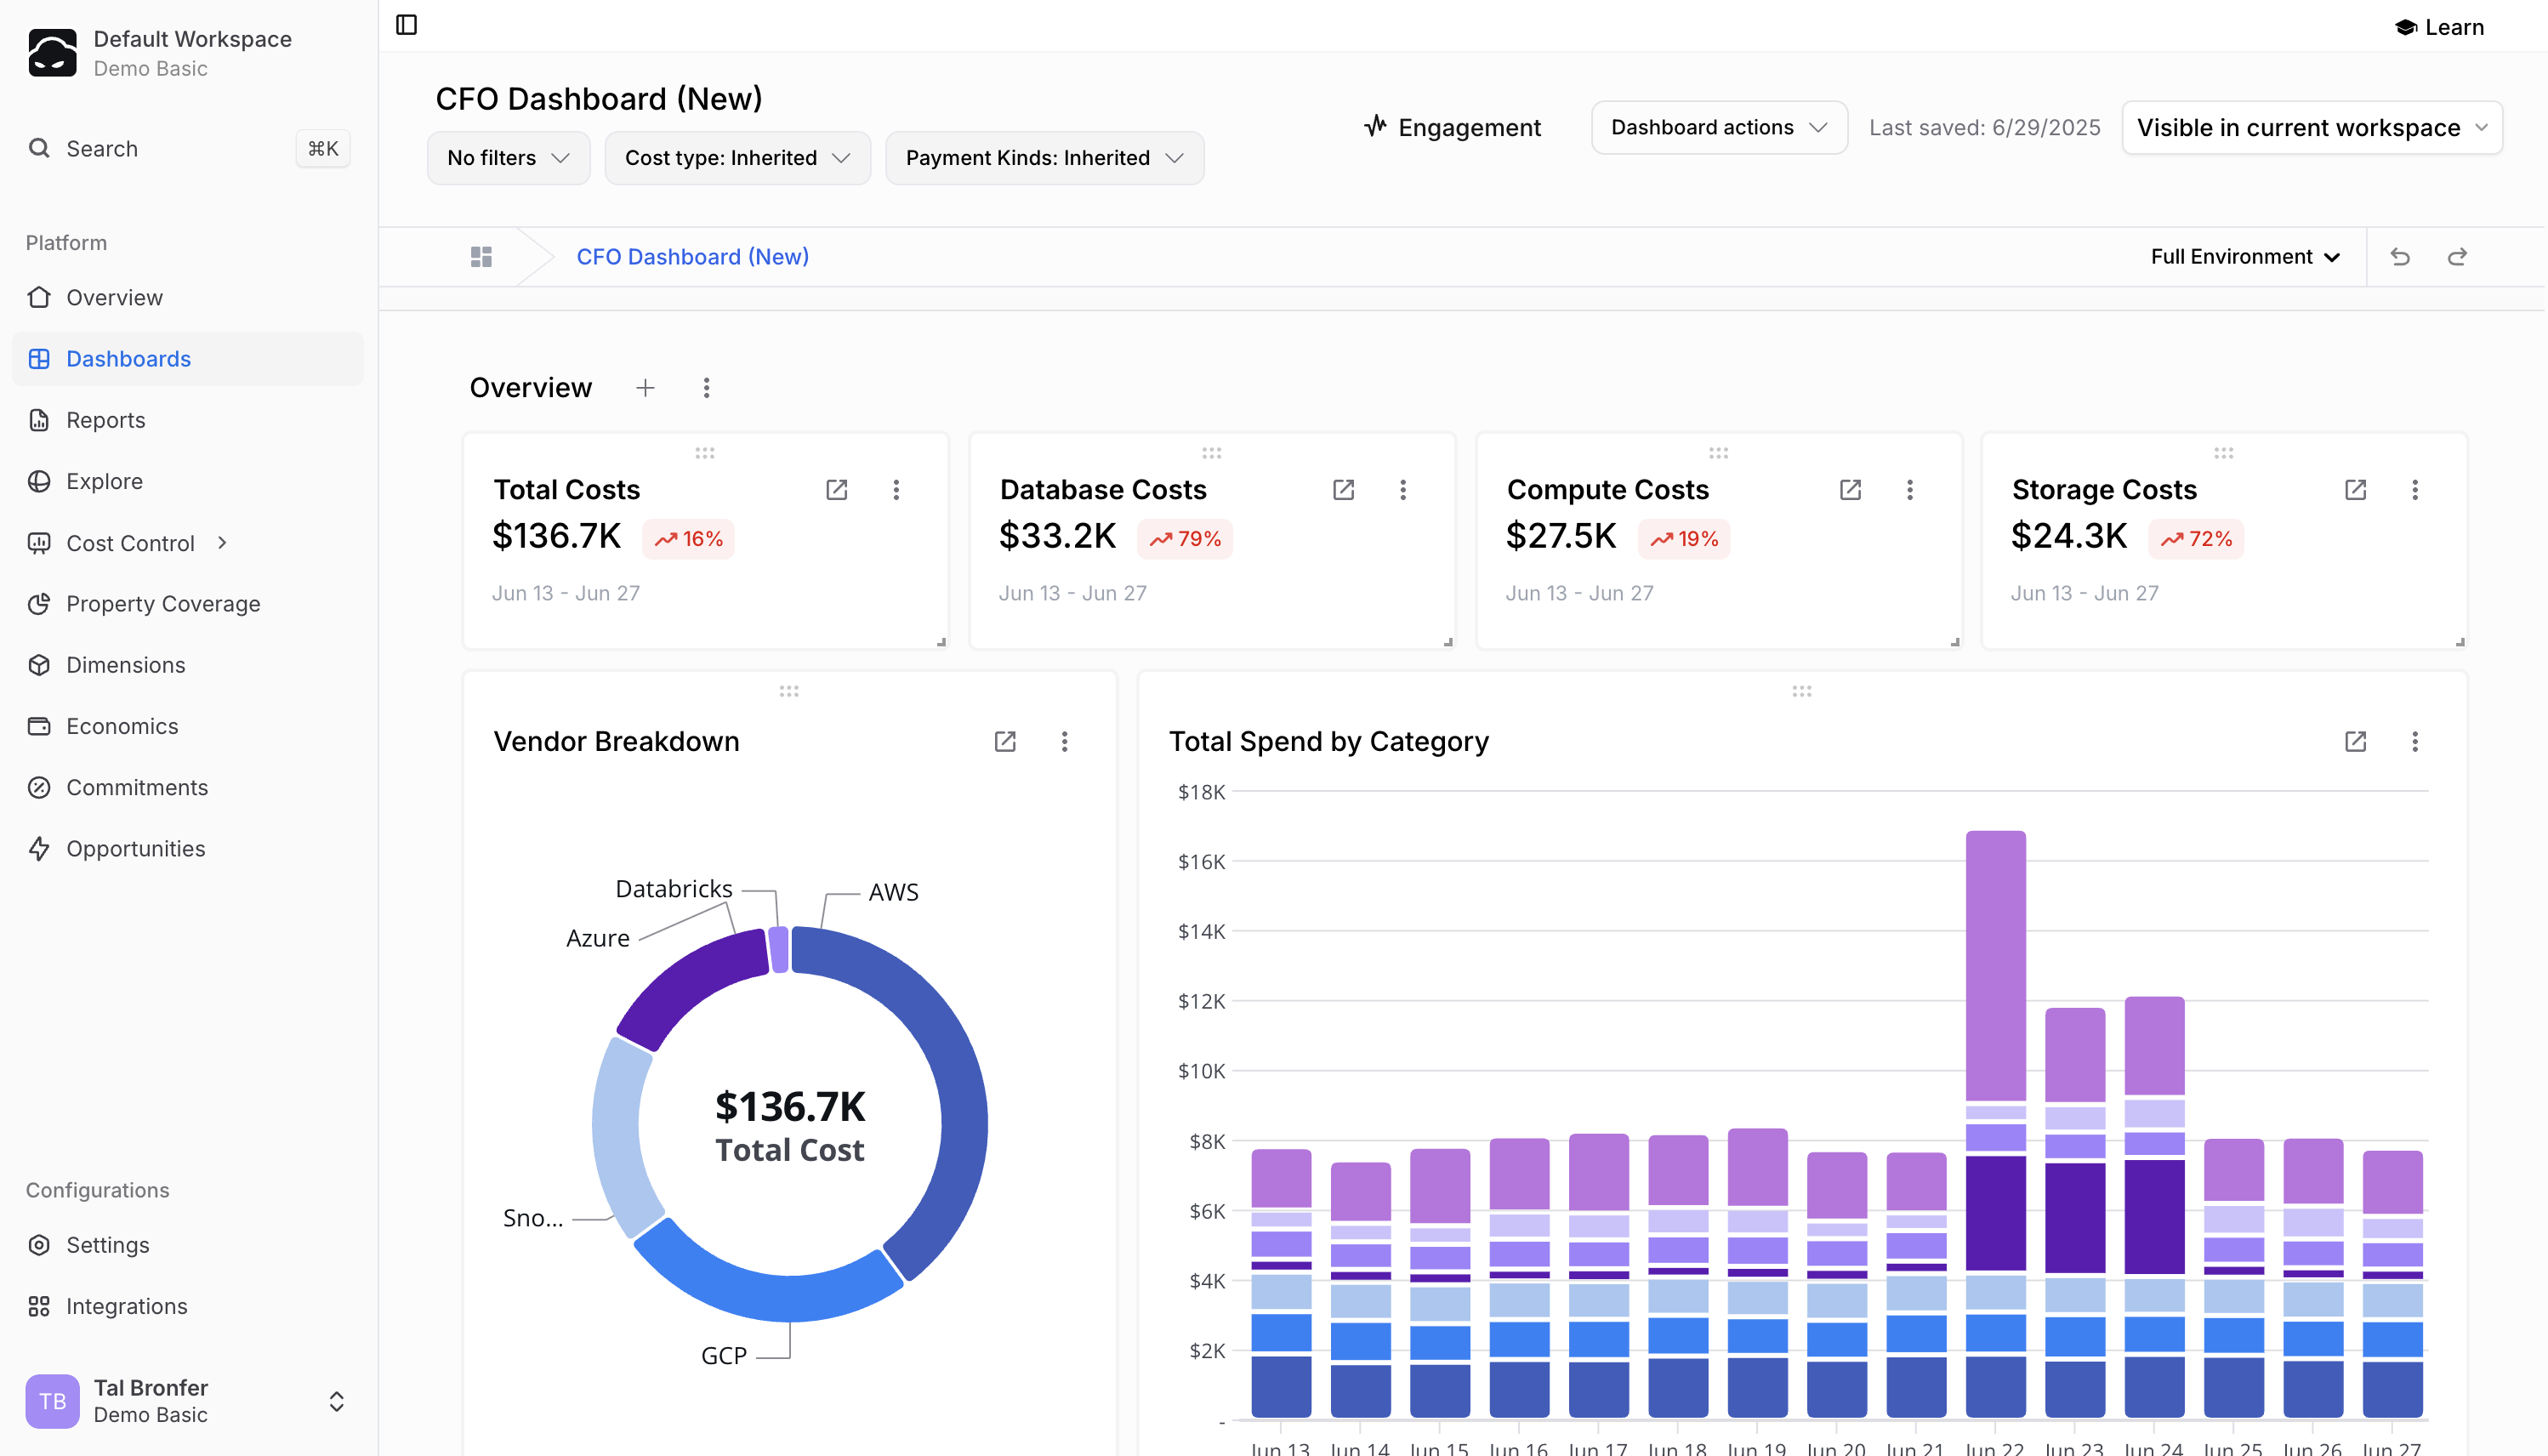 Pelanor Dashboards provide an easy way to build visualizations for a diverse set of stakeholders. They are fully customizable and can be created by non-technical users by leveraging existing reports created by your organization’s FinOps or DevOps teams, or one of Pelanor’s built-in reports.
Each dashboard consists of:
* **Dashboard Controls** – configuration options and filters that affect the entire dashboard
* **Sections** – logical groupings that separate different parts or data types in the dashboard
* **Widgets** – data visualizations based on existing reports
## Dashboard List
Pelanor Dashboards provide an easy way to build visualizations for a diverse set of stakeholders. They are fully customizable and can be created by non-technical users by leveraging existing reports created by your organization’s FinOps or DevOps teams, or one of Pelanor’s built-in reports.
Each dashboard consists of:
* **Dashboard Controls** – configuration options and filters that affect the entire dashboard
* **Sections** – logical groupings that separate different parts or data types in the dashboard
* **Widgets** – data visualizations based on existing reports
## Dashboard List
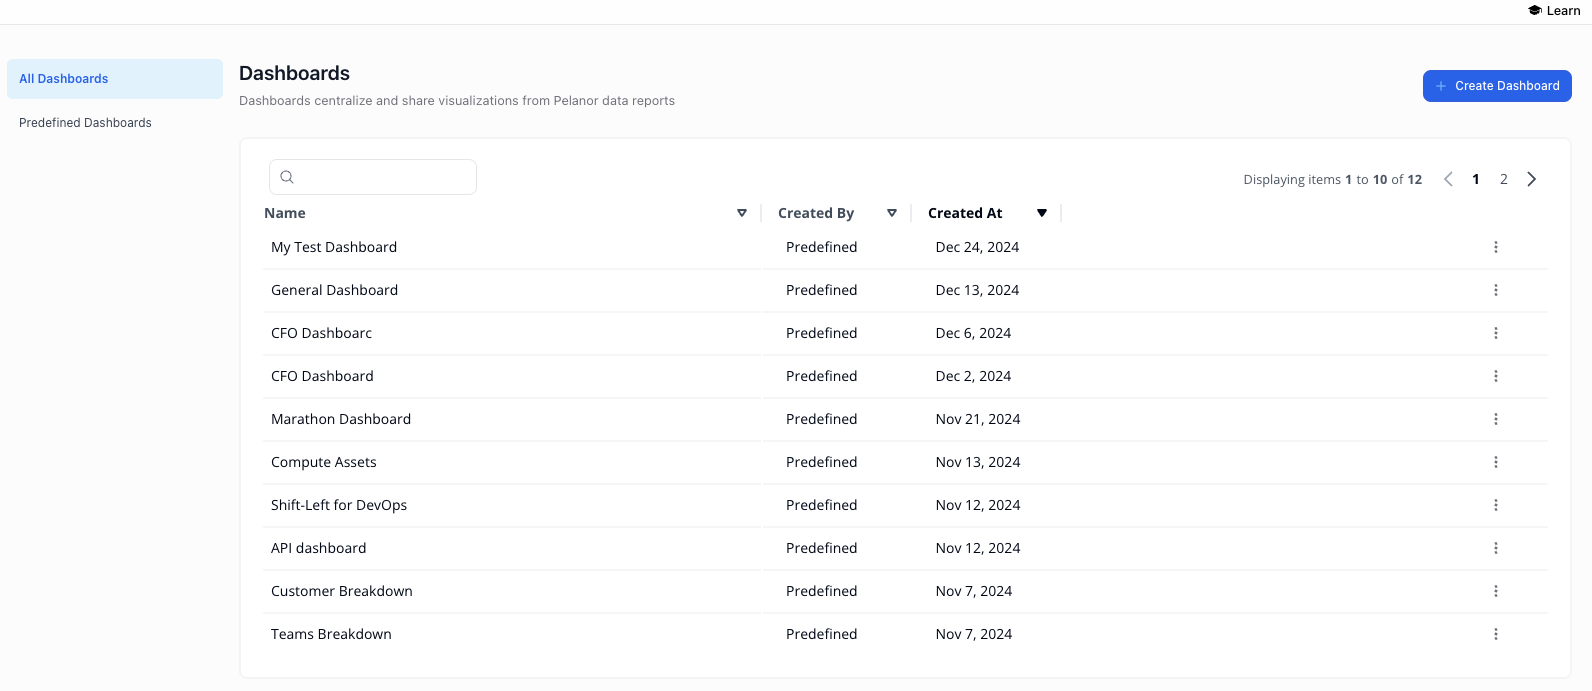 Shows the dashboards that exist in the current Workspace. Click **Create Dashboard** to add a new one.
## Configuring and Personalizing Dashboards
Create a new dashboard or edit an existing one from the **Dashboard List** page.
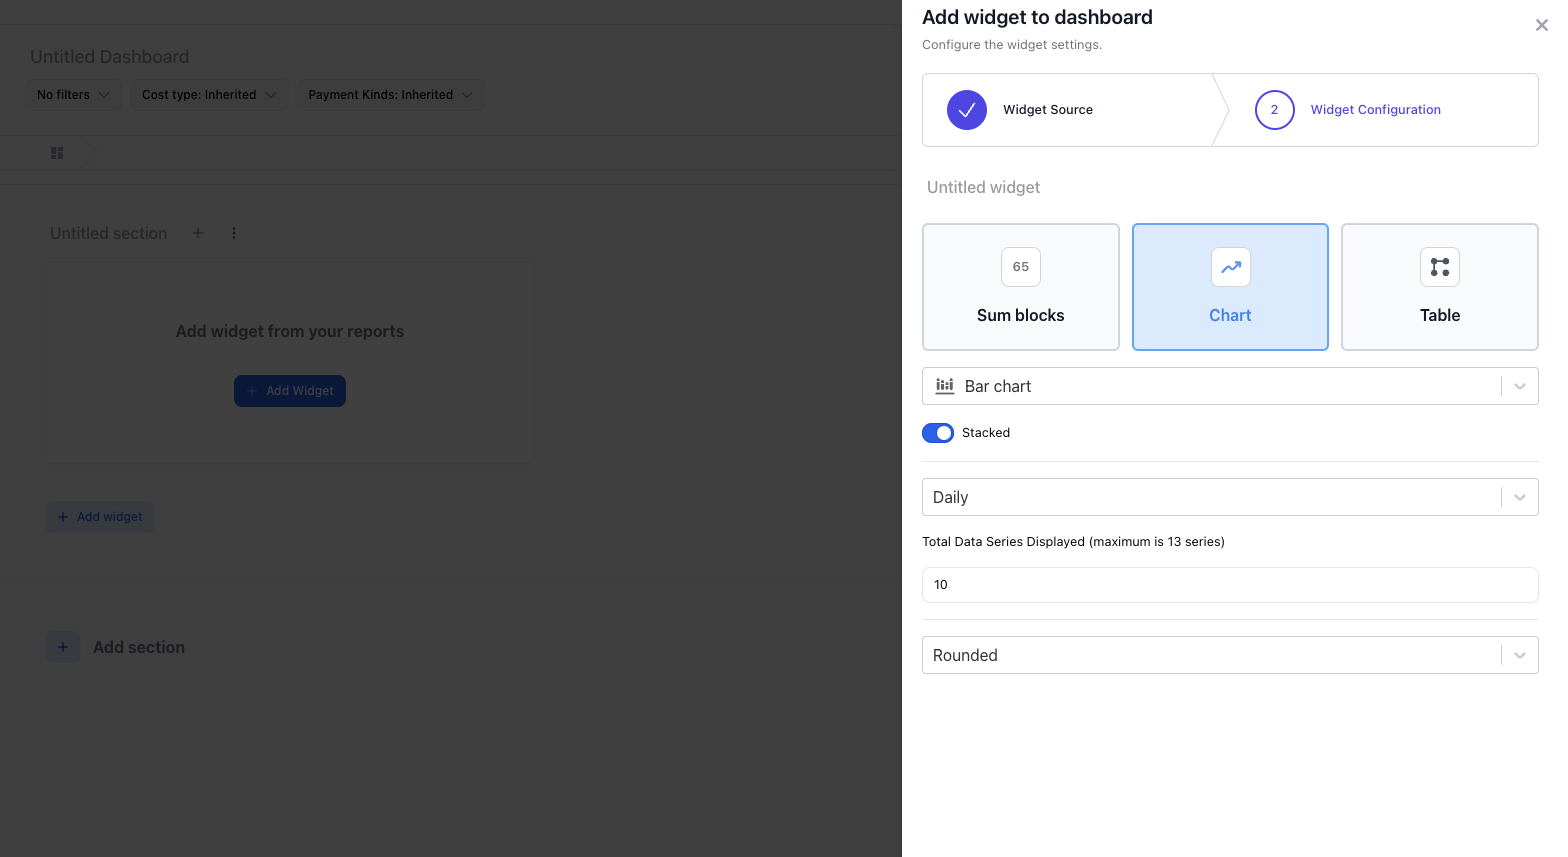
Click the **+** icon and choose **Widget**.
In the side panel, pick the report you want to base the widget on and click **Select**.
Select the **Visualization Type** to display.
Adjust the visualization configuration options as needed (see below).
**Tip:** Use **Sections** (also under the **+** menu) to organize widgets in larger dashboards.
Shows the dashboards that exist in the current Workspace. Click **Create Dashboard** to add a new one.
## Configuring and Personalizing Dashboards
Create a new dashboard or edit an existing one from the **Dashboard List** page.
Click the **+** icon and choose **Widget**.
In the side panel, pick the report you want to base the widget on and click **Select**.
Select the **Visualization Type** to display.
Adjust the visualization configuration options as needed (see below).
**Tip:** Use **Sections** (also under the **+** menu) to organize widgets in larger dashboards.
 A numeric counter displaying the total cost from the selected report. Calculation options:
* **Month To Date** – costs from the start of the current month to today
* **Total** – total cost for the entire date range
* **End of Month Forecast** – projected cost at month-end based on current trends
* **Average Spend** – average daily cost over the date range
Displays the cost chart defined in the chosen report.
* **Visualization Type** – bar, line, pie, donut, horizontal bar, or area (defaults to the report’s setting)
* **Resolution** – adjust the time resolution shown
Shows the cost table returned by the report.
* **Add or Remove Columns** – toggle **Customize columns** to add properties/metrics or remove existing columns
* **Rounding** – enable or disable decimal rounding
* **Cumulative** – show running totals across the time period
## Dashboard Controls
Dashboard-level controls override filters and date ranges defined in individual reports. All controls default to **Inherited**.
You can override:
* **Time Range**
* **Filters**
* **Cost Perspectives** – Amortized, Unblended, On Demand, or Inherited
* **Payment Kinds** – On Demand, Spot, Savings Plan, Fee, Discount, Credit, etc.
## Exporting and Sharing Dashboards
A numeric counter displaying the total cost from the selected report. Calculation options:
* **Month To Date** – costs from the start of the current month to today
* **Total** – total cost for the entire date range
* **End of Month Forecast** – projected cost at month-end based on current trends
* **Average Spend** – average daily cost over the date range
Displays the cost chart defined in the chosen report.
* **Visualization Type** – bar, line, pie, donut, horizontal bar, or area (defaults to the report’s setting)
* **Resolution** – adjust the time resolution shown
Shows the cost table returned by the report.
* **Add or Remove Columns** – toggle **Customize columns** to add properties/metrics or remove existing columns
* **Rounding** – enable or disable decimal rounding
* **Cumulative** – show running totals across the time period
## Dashboard Controls
Dashboard-level controls override filters and date ranges defined in individual reports. All controls default to **Inherited**.
You can override:
* **Time Range**
* **Filters**
* **Cost Perspectives** – Amortized, Unblended, On Demand, or Inherited
* **Payment Kinds** – On Demand, Spot, Savings Plan, Fee, Discount, Credit, etc.
## Exporting and Sharing Dashboards
 Dashboards can be shared in two ways: a platform link or a scheduled summary.
### Share Platform Link
Open the dashboard you want to share.
Click **Dashboard Actions → Share**.
The link is copied to your clipboard.
The recipient must sign in to the Pelanor platform to view the dashboard.
### Scheduled Summary / Export
Generate a PDF for external stakeholders or recipients without a Pelanor account.
Open the dashboard you want to export.
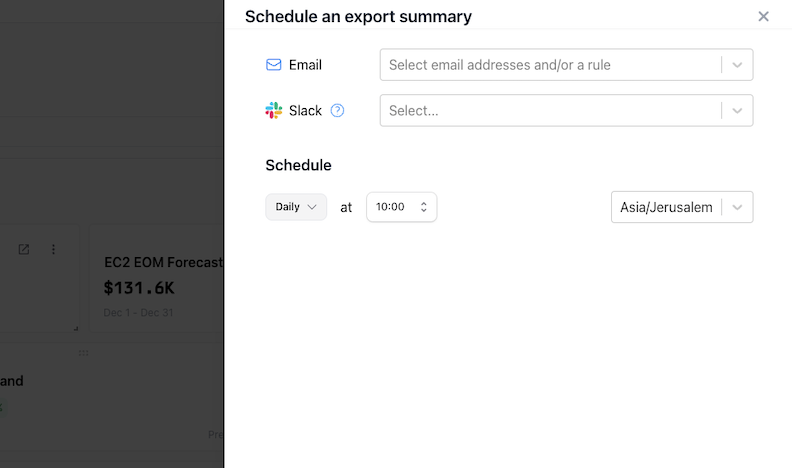
Click **Dashboard Actions → Schedule Summary**.
* **Email** – pick an existing user or enter an email address
* **Slack** – select the channel to send the report
* **Teams** – choose the conversation/channel
Make sure your Slack and/or Teams integrations are configured in **Settings** before setting up a scheduled summary.
### Save Dashboard into Overview
Go to the **Overview** page.
Click the **Settings** (cog) icon.
Select the dashboard to auto-load.
Click **Apply** to save the configuration for all users.
Dashboards can be shared in two ways: a platform link or a scheduled summary.
### Share Platform Link
Open the dashboard you want to share.
Click **Dashboard Actions → Share**.
The link is copied to your clipboard.
The recipient must sign in to the Pelanor platform to view the dashboard.
### Scheduled Summary / Export
Generate a PDF for external stakeholders or recipients without a Pelanor account.
Open the dashboard you want to export.
Click **Dashboard Actions → Schedule Summary**.
* **Email** – pick an existing user or enter an email address
* **Slack** – select the channel to send the report
* **Teams** – choose the conversation/channel
Make sure your Slack and/or Teams integrations are configured in **Settings** before setting up a scheduled summary.
### Save Dashboard into Overview
Go to the **Overview** page.
Click the **Settings** (cog) icon.
Select the dashboard to auto-load.
Click **Apply** to save the configuration for all users.