> ## Documentation Index
> Fetch the complete documentation index at: https://docs.pelanor.io/llms.txt
> Use this file to discover all available pages before exploring further.
# Custom Metrics & Unit Economics
> Inject external business or technical metrics into Pelanor—whether you need unit-economics KPIs (e.g., cost per API call) or simply want to display custom metrics alongside cloud costs.
## Overview
Custom metrics add context to your cloud spend. They power two primary use-cases:
1. **Unit Economics** – combine cost with a business KPI (users, API calls, GB processed) to track efficiency trends.
2. **Enhanced Reporting** – surface any metric as a column, filter, or chart in standard Pelanor reports and dashboards.
***
## Metric Types
| Type | Description | Example | Best For |
| ----------------------- | ---------------------------------------------- | --------------------------------- | -------------------------------- |
| **Basic Metrics** | A single count value per timestamp. | Total daily active users | Org-level KPIs (users, requests) |
| **Dimensional Metrics** | Metric values split by one or more properties. | Active users per *region* per day | Deeper analysis across segments |
## Getting Started
### Integration Options
#### API Integration *(recommended)*
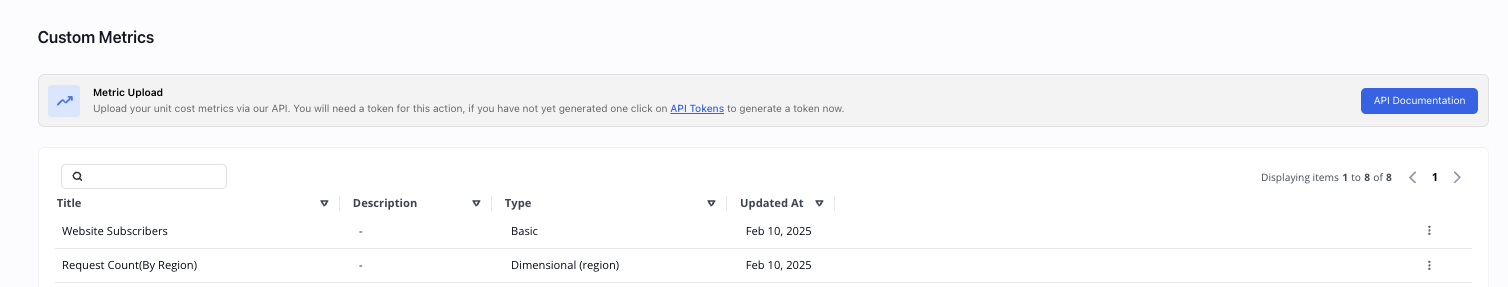
Navigate to **Unit Cost → Custom Metrics** in Pelanor.
Click **API Documentation** to view payload schemas and examples.
POST metrics to the `/v1/custom-metrics` endpoint using the documented format.
[Pelanor API Docs](https://app.pelanor.io/api-docs#tag/default/put/v1/custom-metrics/)
***
1. Pelanor can ingest periodic CSVs dropped into a dedicated S3 bucket or uploaded manually.
2. Contact Support to configure ingestion.
Pelanor can pull metrics from common observability back-ends:
* **Datadog**
* **Amazon CloudWatch**
* **Snowflake**
Reach out to enable automatic collection.
After upload, processing may take a few minutes before metrics become searchable.
***
## Accessing Your Metrics
Imported metrics appear in two places:
1. **Reports & Dashboards** – add a metric as a column, filter, or chart just like built-in cost metrics.
2. **Unit Cost Dashboard** – a purpose-built view that pairs cost with a denominator metric to compute unit costs.
***
### Unit Cost Dashboard
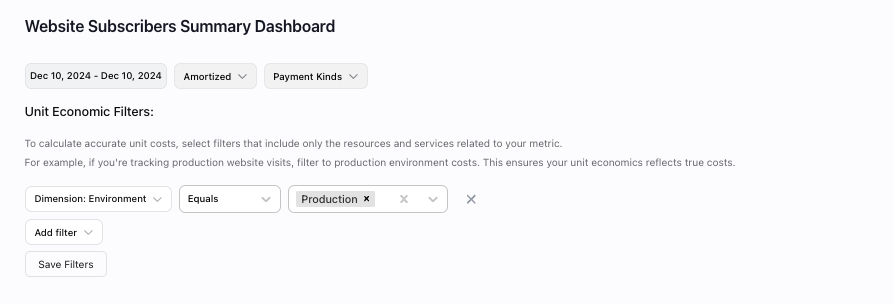
 #### Cost Filters
Refine which costs participate in unit-cost calculations—for example, include only production spend or tag-based subsets.
#### Cost Filters
Refine which costs participate in unit-cost calculations—for example, include only production spend or tag-based subsets.
 ***
## Using the Dashboard
Select which resources should count toward your calculations.
Choose the analysis window (daily, weekly, monthly).
Pick how to roll up data—daily, weekly, or monthly.
***
## Using the Dashboard
Select which resources should count toward your calculations.
Choose the analysis window (daily, weekly, monthly).
Pick how to roll up data—daily, weekly, or monthly.
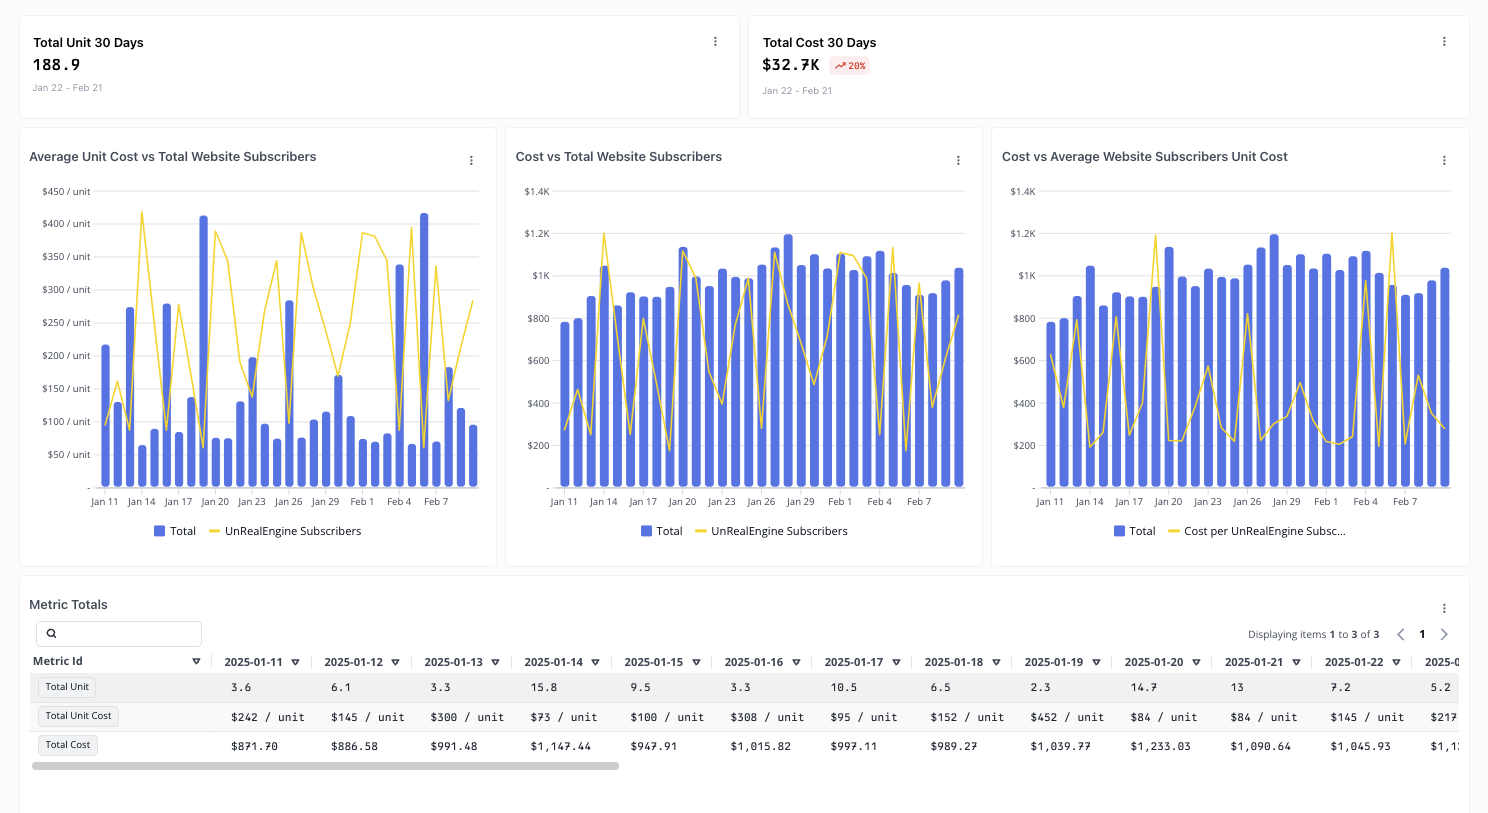
- Current vs. previous period summaries
- Unit-cost trends
- Cost-distribution charts
- Detailed tables
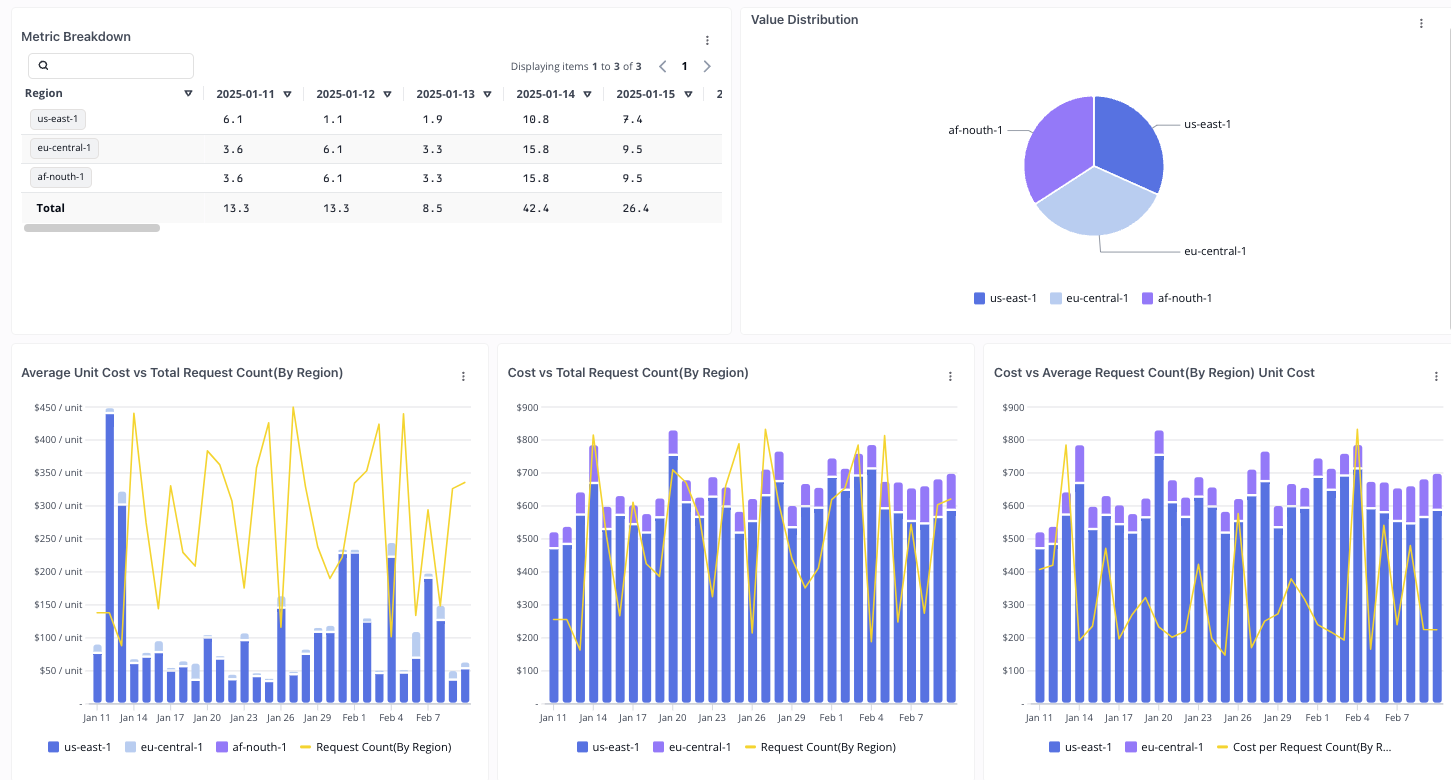
 Includes everything from Basic Metrics, plus segment breakdowns (e.g., by region).
 ***
## Working with Widgets
In any widget menu, click **Add to dashboard**.
***
## Working with Widgets
In any widget menu, click **Add to dashboard**.
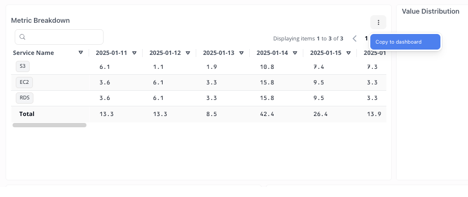 Choose which dashboard should host the widget.
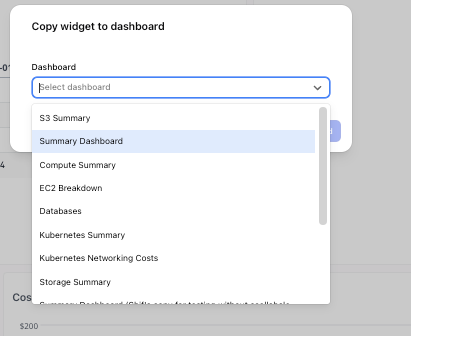 The widget is appended to the destination dashboard automatically.