Overview
Custom metrics add context to your cloud spend. They power two primary use-cases:- Unit Economics – combine cost with a business KPI (users, API calls, GB processed) to track efficiency trends.
- Enhanced Reporting – surface any metric as a column, filter, or chart in standard Pelanor reports and dashboards.
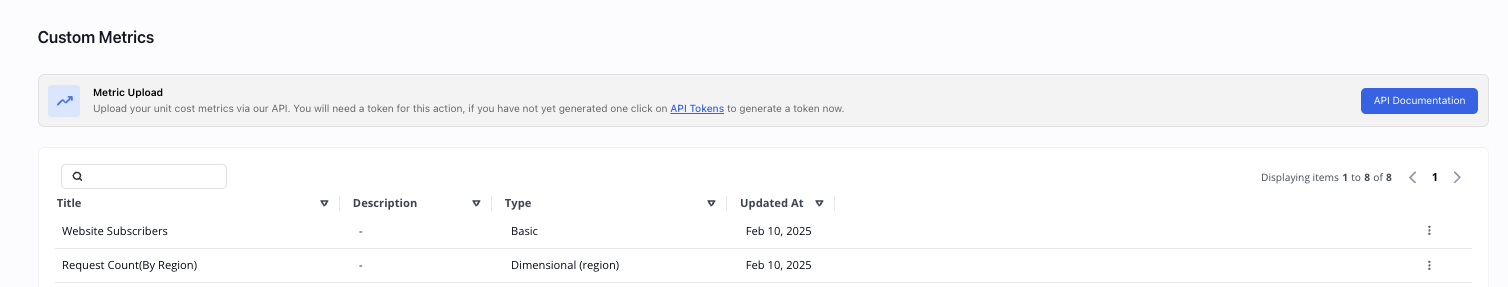
Metric Types
| Type | Description | Example | Best For |
|---|---|---|---|
| Basic Metrics | A single count value per timestamp. | Total daily active users | Org-level KPIs (users, requests) |
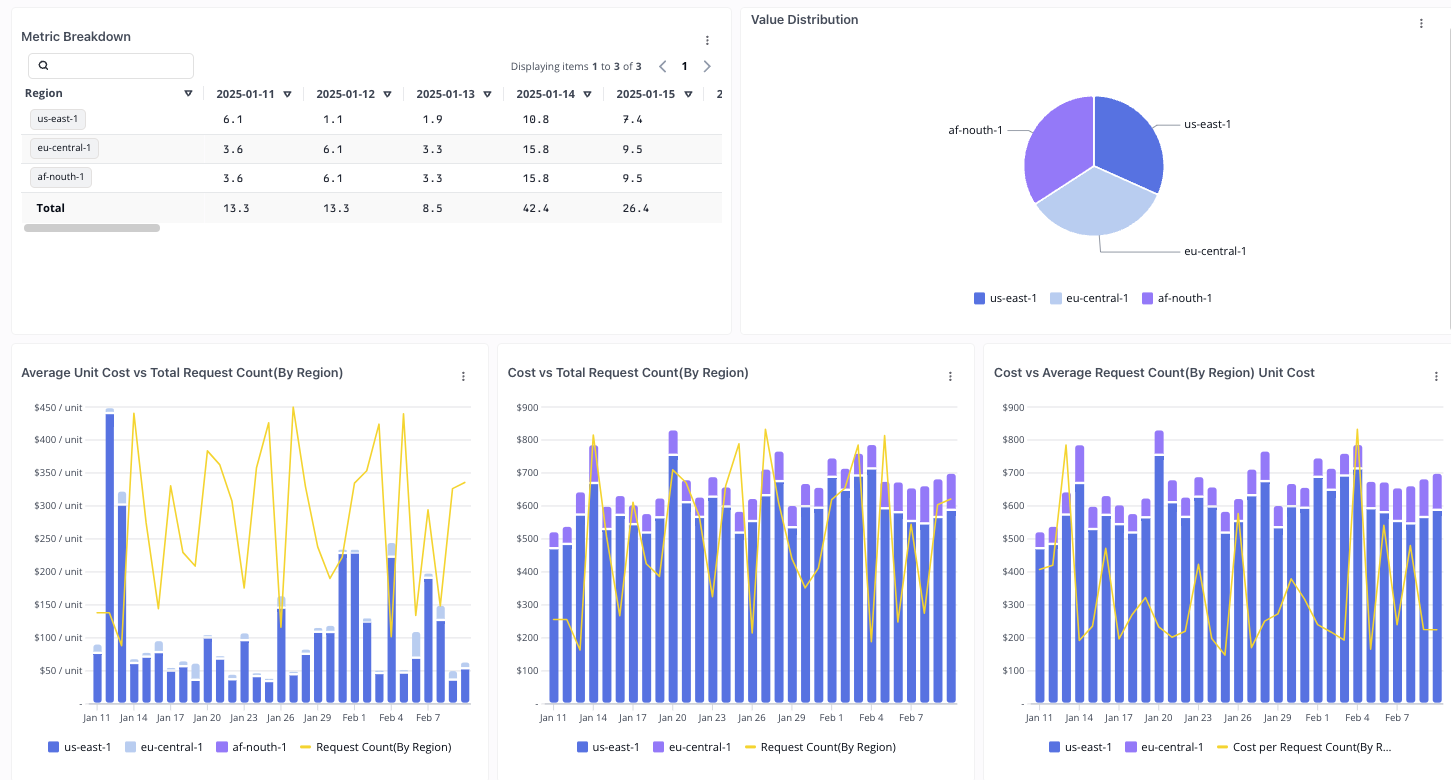
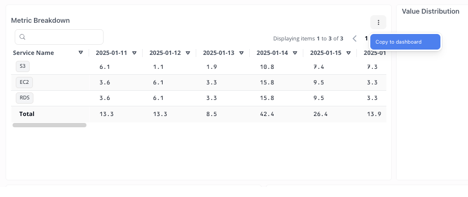
| Dimensional Metrics | Metric values split by one or more properties. | Active users per region per day | Deeper analysis across segments |
Getting Started
Integration Options
API Integration (recommended)
Pelanor API Docs
- Direct Data Upload
- Autonomous Collection
- Pelanor can ingest periodic CSVs dropped into a dedicated S3 bucket or uploaded manually.
- Contact Support to configure ingestion.
After upload, processing may take a few minutes before metrics become searchable.
Accessing Your Metrics
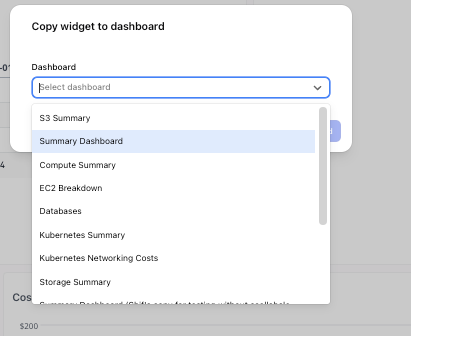
Imported metrics appear in two places:- Reports & Dashboards – add a metric as a column, filter, or chart just like built-in cost metrics.
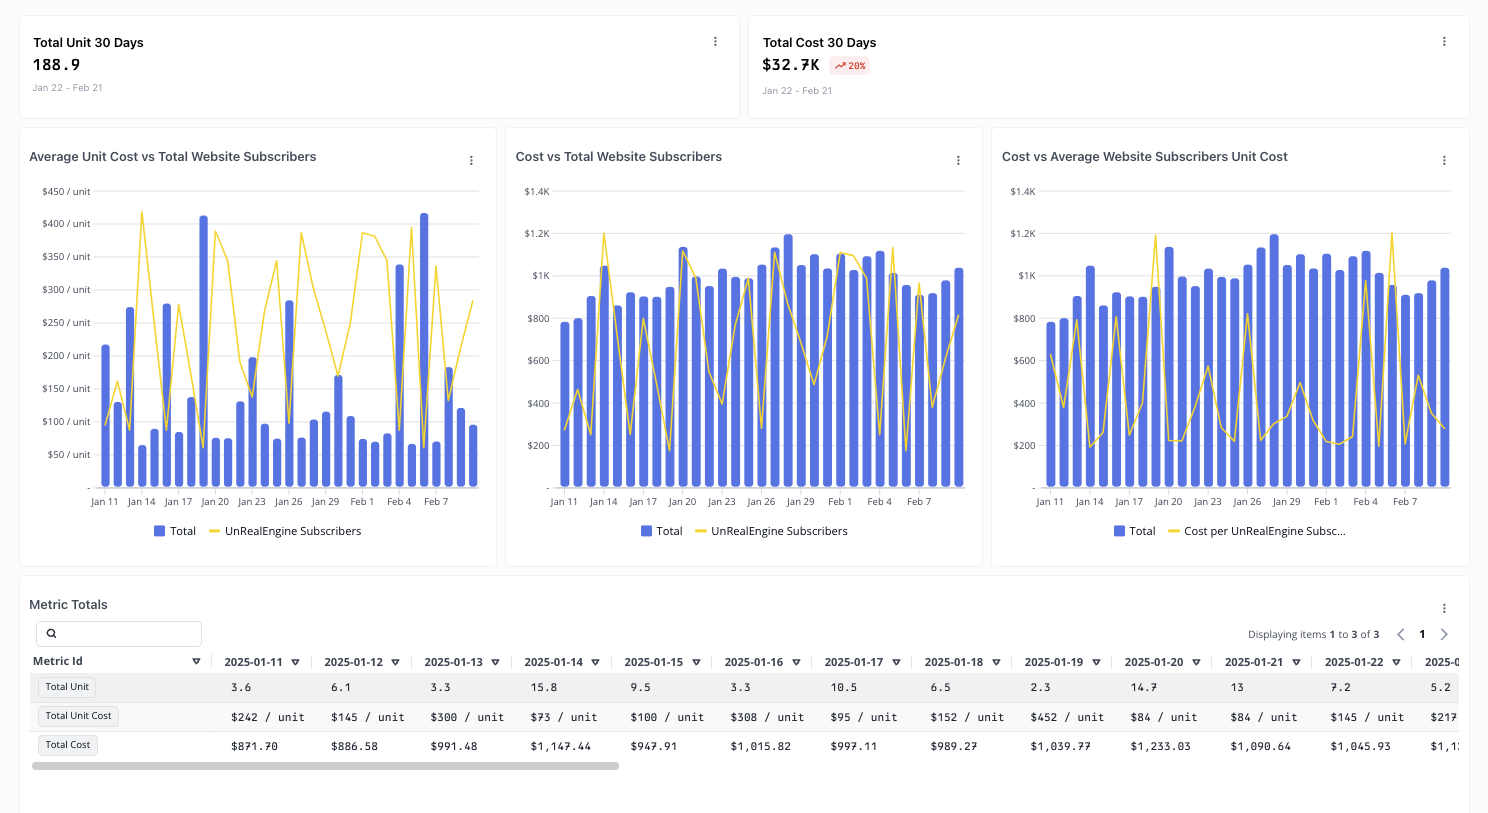
- Unit Cost Dashboard – a purpose-built view that pairs cost with a denominator metric to compute unit costs.
Unit Cost Dashboard
Cost Filters
Refine which costs participate in unit-cost calculations—for example, include only production spend or tag-based subsets.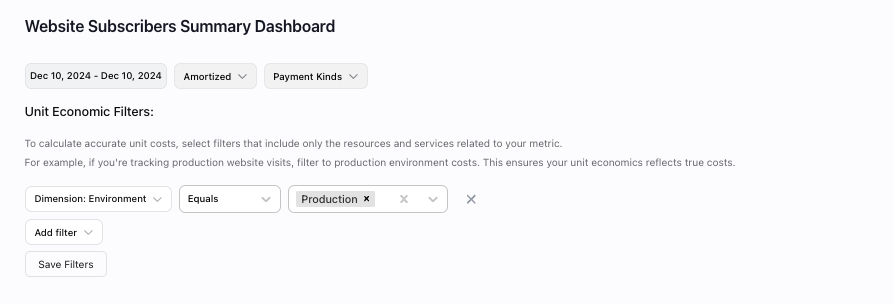
Using the Dashboard
- Basic Metrics
- Dimensional Metrics
- Current vs. previous period summaries
- Unit-cost trends
- Cost-distribution charts
- Detailed tables